Phase 1: data foundations
Start with tables, keys, grain, missing values, duplicates, and the difference between a fact and a dimension. Practise loading a small dataset and documenting what each field means.
Phase 2: Power Query and modelling
Learn repeatable transformations, relationships, star-schema thinking, and refresh behaviour. Keep a change log so another analyst can understand how the model was prepared.
Phase 3: DAX and metric logic
Build measures for totals, ratios, time comparisons, and filtered views. Explain the business definition of every KPI before writing the formula.
Phase 4: dashboards and decisions
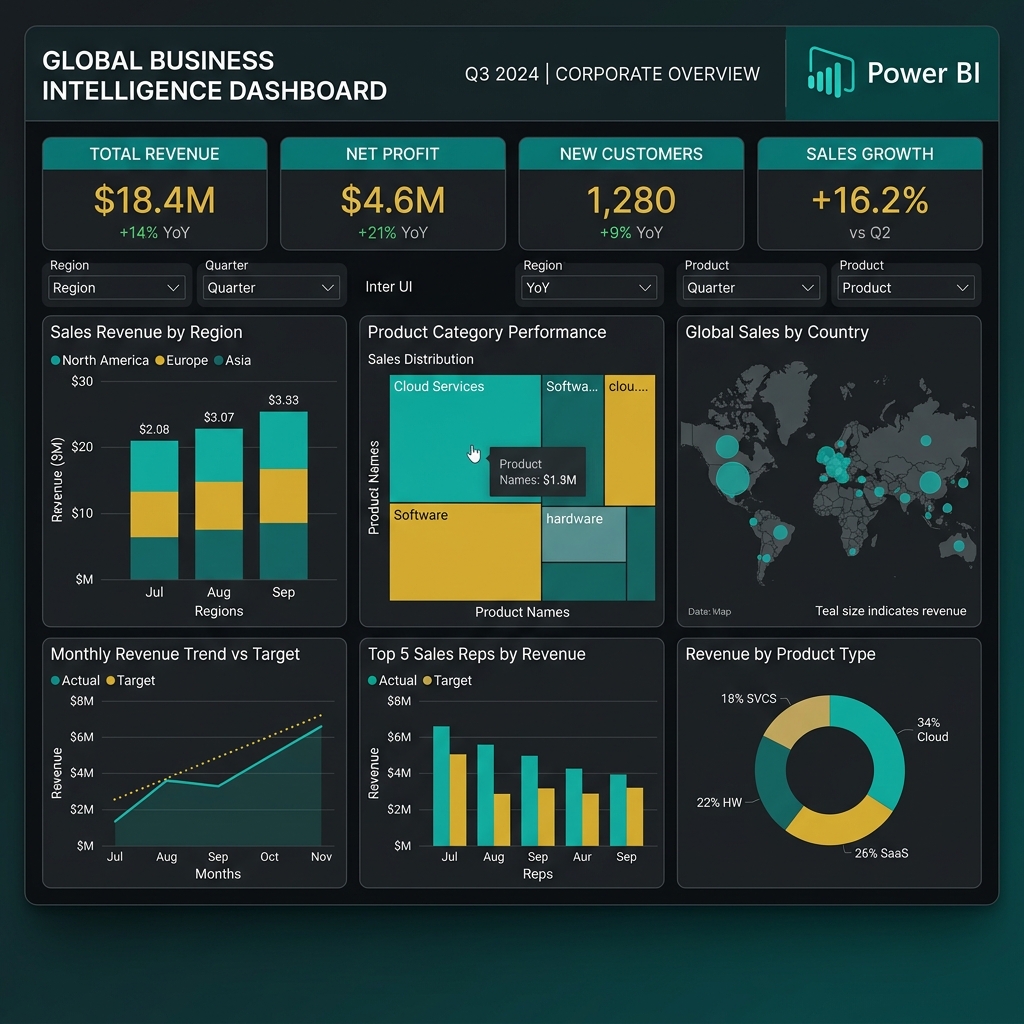
Choose a small number of visuals, make filters understandable, show context, and write the decision a stakeholder should be able to make. Avoid decorative charts that do not answer a question.
Phase 5: portfolio project
Use a reproducible dataset, state the business question, show the model, document metric definitions, and include a short walkthrough. Pair this roadmap with Power BI project ideas and the course comparison.
Build stronger analytics foundations
Review the ISS Data & Business Intelligence curriculum and online learning format.
View Data & BI curriculum →Editorial scope
Tool features and licensing change. Check Microsoft’s current documentation before relying on a specific interface or capability.