Publisher disclosure: ISS offers a competing training programme. Use this guide as a comparison framework and verify each provider’s current details.
Power BI is not valuable because it can generate colorful charts. It is valuable because it helps teams decide what to fix, double down on, or stop. Best training programmes teach you how to move from raw business tables to clean, decision-ready dashboards.
If course only trains you to drag fields into visuals, you become dashboard operator. If it trains SQL retrieval, DAX logic, KPI framing, and stakeholder communication, you become business analyst companies pay more for.
Pair this course comparison with the data analyst salary guide and Power BI project guide so you evaluate both market questions and practical work.
What Decision-Grade Power BI Actually Means
Companies do not buy dashboards for decoration. They buy speed of understanding. A strong Power BI analyst converts rows into business choices: where margin is leaking, which customer cohorts retain, which products should get inventory, and where growth is stalling.
Data Retrieval
Pull usable data from SQL tables, not only exported spreadsheets.
KPI Framing
Choose metrics that leadership can act on, not vanity visuals.
The Power BI Skills Trap
Many beginners think that learning Power BI is simply about importing an Excel sheet and drag-and-dropping fields to create bar charts. This is a common trap. Startups and VC-backed brands in India have massive volumes of raw data stored in relational databases. They don't need someone to make pretty, useless charts. They need business intelligence analysts who can write a SQL query to join customer tables, load the results into Power BI, write DAX calculations to compute complex KPIs, and explain the findings to stakeholders.
Comparing Power BI Courses in India
Here is how different education formats in India stack up when teaching business intelligence tools:
| Training Format | Database Access | Business Context | Outcome Focus |
|---|---|---|---|
| Pre-recorded Videos | Static dummy Excel sheets | Minimal (generic datasets) | Completion badge |
| Corporate Seminars | Standard sample tables | Hypothetical use-cases | Generic certification |
| ISS Cohort (Data & BI) | Live SQL queries on database | Real business metrics | 3 published live dashboards |
Database-first thinking
Courses should teach live database access, joins, filtering, and aggregation before dashboard polish.
Business metric logic
Strong programmes force you to compute CAC, retention, margins, and trend metrics using clean DAX design.
Decision-friendly layouts
Real dashboards use hierarchy, filters, annotations, and clear comparisons so non-technical stakeholders act faster.
Portfolio with business proof
Best outcomes come from dashboards tied to business scenarios you can explain in interviews and case reviews.
Why Power BI Is a Strong Career Path
High Demand
Every data-driven team needs clear reporting owners.
Good Salary Growth
Pay rises when dashboards connect to business decisions.
Cross-Functional Impact
BI work supports product, growth, finance, and ops.
Future-Proof Base
AI still needs humans who can define good metrics.
Is the ISS Data & Business Intelligence programme right for you?
Review the curriculum for SQL, data analysis, and dashboard projects. Compare the learning format, weekly commitment, fees, and support with your goals before applying.
View Data & Business Intelligence curriculum →Key Business Intelligence Modules
To land high-paying BI analyst roles, your training must cover four critical technical areas:
- SQL Retrieval: Writing SELECT, WHERE, JOIN, and GROUP BY operations to pull business data from relational databases.
- Data Transformation: Cleaning and modeling data within Power BI's Power Query editor.
- DAX Formula Design: Writing CALCULATE, RELATED, DIVIDE, and Time Intelligence functions to compute custom business metrics.
- Data Storytelling: Designing dashboard layouts with visual hierarchy, filters, and tooltips that match stakeholder needs.
Launch your BI career with portfolio proof
ISS Data & BI track is built around three dashboards, stakeholder-style review, and weekly SQL-to-visual thinking. You learn how numbers move through database, model, and final business narrative.
- Mentor review on query quality and KPI framing
- Dashboard critique on layout, filters, and clarity
- Interview-ready project stories with impact language
- Placement support for analytics and BI roles
Learners finish with interview-ready proof, not only tool familiarity.
High-Value Business Intelligence Skills
What You Will Build for Your Portfolio
At ISS, you will not receive a theoretical grade. You will build and publish three functional dashboards that simulate corporate requirements:
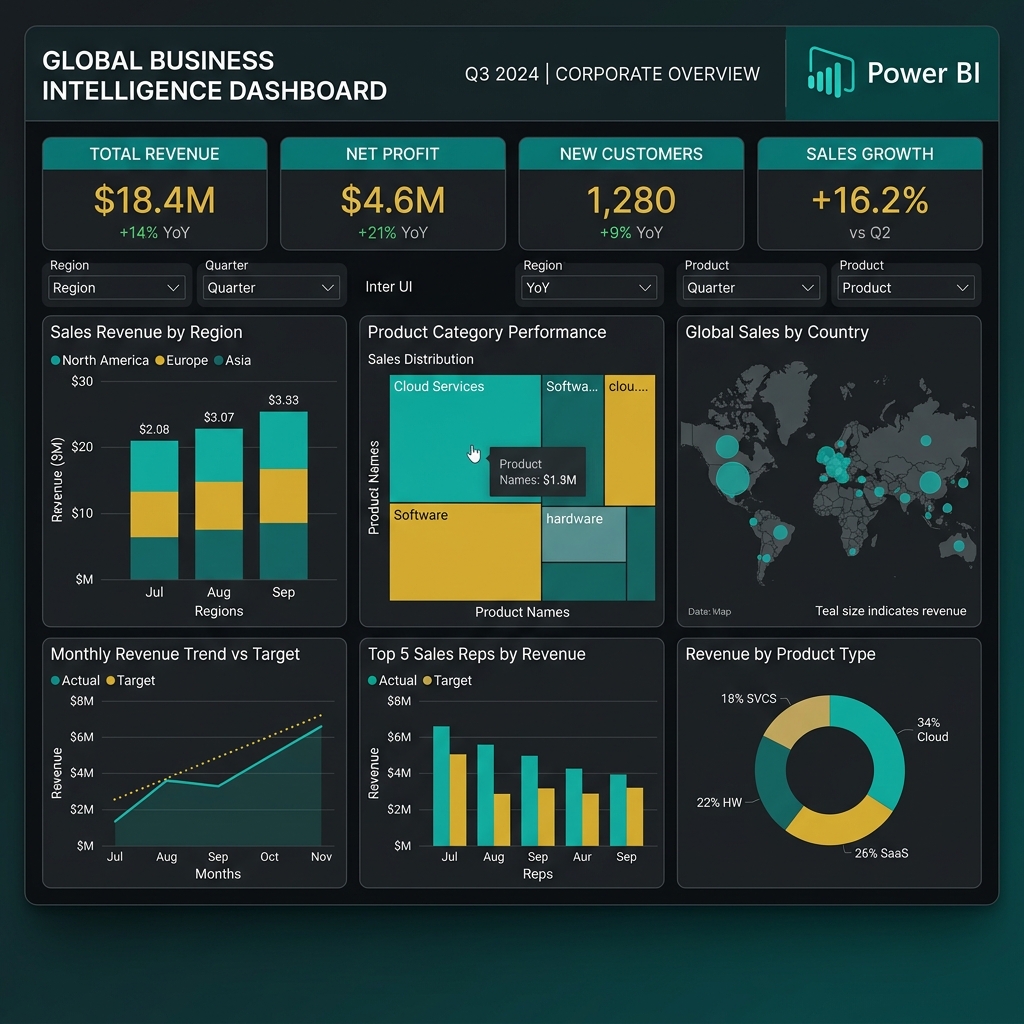
- Sales & Revenue Dashboard: Track sales growth YoY, calculate net profit margins using DAX, and show trends by product category.
- User Engagement Dashboard: Analyze customer retention, monthly active users (MAU), and cohort drop-off rates.
- Operational Efficiency Report: Monitor logistics times, tracking courier performance and delivery delays across regions.
Tools every strong BI learner should touch
Salary Scope in India
BI Analysts are essential to data-driven decision making. In India, entry-level data and BI analysts earn ₹3–5 LPA. Mid-level professionals (2-4 years) with SQL fluency and dashboard ownership reach ₹6–12 LPA. Senior leads can earn ₹14–25+ LPA by demonstrating direct business impact.
Not sure if Data Analytics fits your career path? Take our free 20-minute cognitive skills assessment and check your fit.
Take Free Assessment →