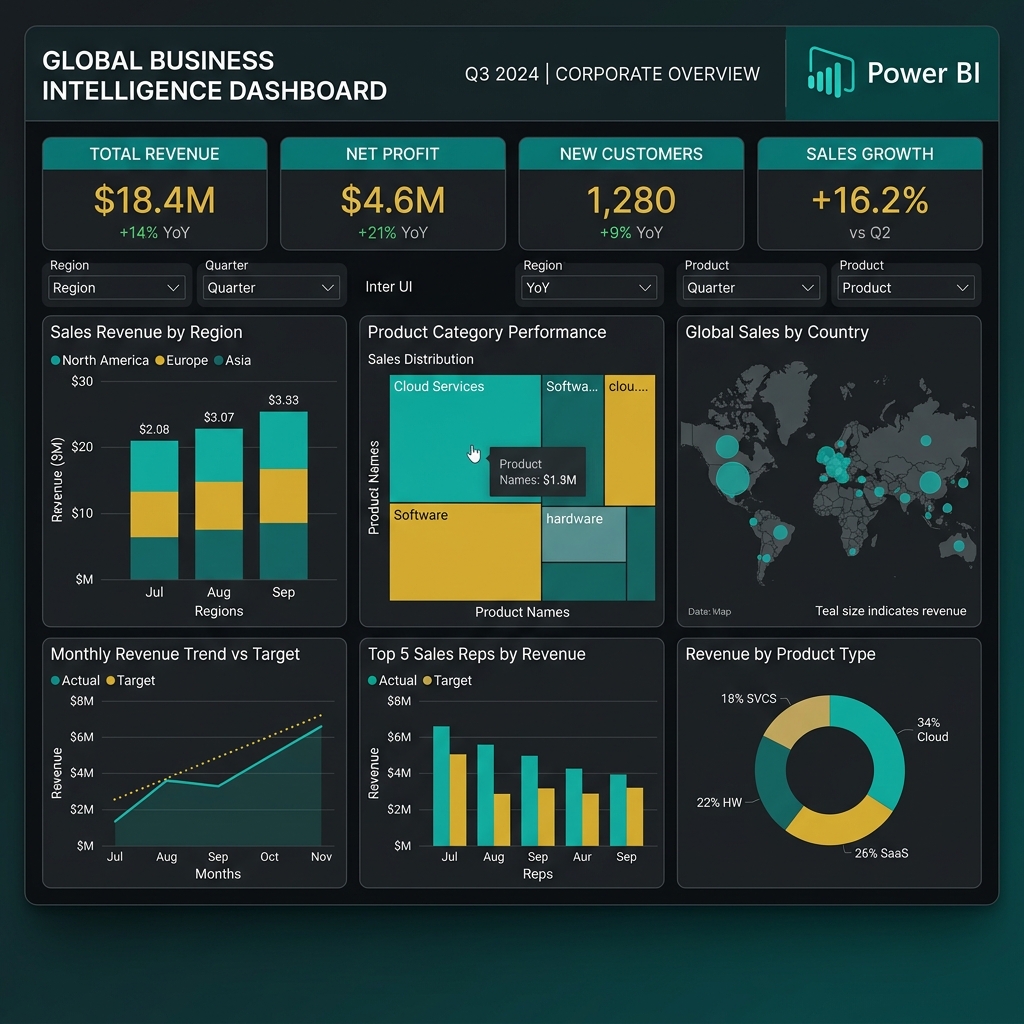
Power BI vs Tableau at a glance
| Factor | Power BI (Microsoft) | Tableau (Salesforce) |
|---|---|---|
| Main authoring app | Power BI Desktop, free download | Tableau Desktop (paid licence) or Tableau Desktop Public Edition (free) |
| Operating system for the desktop app | Windows only (Windows 10 or later is the stated minimum) | Windows and Mac |
| Free way to learn | Power BI Desktop plus a free account; sharing needs Pro or Premium | Tableau Public: free, but published work is visible to anyone |
| Listed paid price (checked September 2026) | Pro ₹1,165 and Premium Per User ₹1,995 per user per month, paid yearly, GST extra | Tableau Cloud "starting at" US$15 per user per month, billed annually; role prices vary |
| Calculation language | DAX for measures, Power Query (M) for data preparation | Calculated fields, table calculations and LOD expressions; Tableau Prep for data preparation |
| Ecosystem fit | Microsoft 365, Excel, Teams, Azure and Fabric | Salesforce, and a wide range of databases and cloud warehouses |
| Vendor certification | Microsoft Certified: Power BI Data Analyst Associate (exam PL-300) | Salesforce Certified Tableau Data Analyst |
| Often chosen for | Company-wide reporting at a lower per-user cost, Excel-heavy teams | Visual exploration, design flexibility, public portfolios |
Prices and plan names come from the vendors' official pages and change often. Always check the current page before you buy, and note that Tableau's page lists prices in US dollars, not rupees.
How do Power BI and Tableau differ in features?
For a beginner, both tools cover the same core jobs: connect to data, clean it lightly, build charts, combine them into an interactive dashboard and share it. The differences show up in how you get there.
Power BI puts a lot of weight on the data model. You load tables, create relationships (a star schema, ideally) and write DAX measures that respond to filters. Power Query handles cleaning steps such as splitting columns, unpivoting and merging files. If you already live in Excel, the ribbon layout and Power Query will feel familiar.
Tableau puts the visual first. You drag fields onto rows, columns and the Marks card and the chart updates immediately, which makes it quick for exploring a new dataset. Calculations use calculated fields, table calculations (such as running totals and percent of total) and level of detail (LOD) expressions for fixed-grain questions.
Both vendors are adding AI assistants. Salesforce's analytics pricing page lists a separate Tableau Next plan with agentic features, and Microsoft offers Copilot in Power BI with its own licensing requirements. Check each vendor's current page before assuming a feature is included in a given plan.
What does the same calculation look like in each tool?
Here are three common analyst questions on a sales table with Sales, Profit, Customer ID and Order Date fields.
| Question | Power BI (DAX) | Tableau |
|---|---|---|
| Profit margin | DIVIDE ( SUM ( Sales[Profit] ), SUM ( Sales[Sales] ) ) | SUM([Profit]) / SUM([Sales]) |
| Share of total sales | DIVIDE ( SUM ( Sales[Sales] ), CALCULATE ( SUM ( Sales[Sales] ), ALL ( Sales ) ) ) | SUM([Sales]) / TOTAL(SUM([Sales])) (a table calculation) |
| Each customer's first order date | Calculated column in a Customers table: CALCULATE ( MIN ( Sales[Order Date] ) ) | {FIXED [Customer ID] : MIN([Order Date])} (an LOD expression) |
The simple cases look alike. The harder concepts are different: in Power BI you need to understand filter context and CALCULATE; in Tableau you need to understand the order of operations between filters, LOD expressions and table calculations. Our guide to 25 DAX functions in Power BI walks through filter context on a sample model.
How much do Power BI and Tableau cost?
For an individual learner, both can cost nothing. For a company, the gap can be large.
| Option | Listed price (checked September 2026) | What you get |
|---|---|---|
| Power BI Desktop | Free | Full report authoring on Windows |
| Power BI free account | Free | Create reports; Microsoft says you must upgrade to Pro or Premium to share them |
| Power BI Pro | ₹1,165 per user per month, paid yearly, GST extra | Publish, share and collaborate on reports |
| Power BI Premium Per User | ₹1,995 per user per month, paid yearly, GST extra | Pro features plus larger-scale and advanced capabilities |
| Tableau Public / Desktop Public Edition | Free | Build vizzes; anything published is public; up to 15 million rows per workbook; extracts only |
| Tableau Cloud | Starting at US$15 per user per month, billed annually | Hosted Tableau; the listed starting price does not state the role, and Creator, Explorer and Viewer roles are priced differently, so check Tableau's pricing page |
We have not converted Tableau's dollar price to rupees because the final bill depends on exchange rates, taxes and the reseller. For team pricing, ask the vendor or a partner for a quote.
Learn the analysis behind the dashboard
Whichever tool you pick, employers test SQL, data cleaning and how you explain a finding. The ISS Data & Business Intelligence program page lists SQL, Python, data cleaning and BI dashboards, with a Looker dashboard in the capstone; it does not list Power BI or Tableau as a core tool, so ask admissions if one matters to you. The free Data Analyst Starter Kit on this page has project briefs you can build in either tool.
View Data & Business Intelligence curriculum →Which is easier to learn, Power BI or Tableau?
Neither is hard to start. You can build a decent first dashboard in either tool within a weekend. The difficulty shows up later, in different places.
| Stage | Power BI | Tableau |
|---|---|---|
| First chart | Easy, especially for Excel users | Easy; drag-and-drop feels natural |
| Cleaning and shaping data | Power Query is built in and powerful | Basic cleaning in Desktop; heavier work in Tableau Prep or upstream in SQL |
| Where it gets hard | DAX filter context, CALCULATE, time intelligence, data modelling | LOD expressions, table calculations and the order of filter operations |
| Design polish | Good with themes and templates | More fine-grained control over visual design |
| Building a public portfolio | Needs a workaround, such as screenshots, a video walkthrough or a GitHub repo with the .pbix file | Tableau Public gives you a shareable profile, but only use public or anonymised data |
A useful rule of thumb: if you think in spreadsheets and formulas, Power BI tends to feel natural. If you think visually and like to explore, Tableau tends to feel natural. Either way, the harder half of the job is the SQL and business thinking behind the dashboard.
Which do Indian employers use, Power BI or Tableau?
We have not published job-count figures here. Listing numbers on job portals change daily and depend heavily on search wording, so any count would be out of date quickly. Instead, use this ten-minute method:
- On two job portals, search "data analyst Power BI" and then "data analyst Tableau", filtered to your target city and to 0–2 years of experience.
- Open the first 20 relevant listings for each search.
- Note how many name only one tool, how many ask for both, and how many say "Power BI or Tableau" or "any BI tool".
- Check the employer type: IT services, captive centres of global companies, startups, banks or consulting firms.
Some general patterns help you read what you find. Organisations already on Microsoft 365 and Azure often standardise on Power BI because licences fit their existing agreements. Companies that run on Salesforce, or analytics teams that adopted Tableau years ago, often keep Tableau. Many fresher listings accept either, because the underlying skill is the same. For wider context on roles and pay, see our data analyst salary guide.
Should you learn Power BI or Tableau first?
| Your situation | Start with | Why |
|---|---|---|
| Your target job posts mostly name one tool | That tool | Match the market you are applying to |
| You work in a company that already uses one | That tool | You can apply it at work straight away |
| You are strong in Excel and use Windows | Power BI | Power Query and the formula style will feel familiar, and Desktop is free |
| You use a Mac | Tableau | Power BI Desktop does not run natively on macOS |
| You want a public, clickable portfolio | Tableau | Tableau Public gives you a free shareable profile |
| No strong signal either way | Either; pick one and finish a project | Switching later takes weeks, not months |
What matters more than the choice is finishing two or three complete projects: a business question, cleaned data, a dashboard and a short written finding. Our Power BI projects for beginners lists ideas that work in either tool.
A 6-week plan to learn one BI tool
This is an ISS suggestion for someone studying about 6–8 hours a week who already knows basic Excel.
| Week | Focus | Output |
|---|---|---|
| 1 | Interface, connecting to CSV and Excel, basic charts | Five single charts from one dataset |
| 2 | Cleaning (Power Query or Tableau Prep) and data modelling | A clean star schema or tidy data source |
| 3 | Calculations (DAX measures or calculated fields) | Revenue, margin and growth metrics |
| 4 | Advanced calculations (time intelligence or LODs and table calcs) | Year-on-year and share-of-total views |
| 5 | Dashboard design, filters and interactivity | A one-page dashboard for a stated audience |
| 6 | Portfolio project and write-up | Dashboard plus three written findings |
Do you need a Power BI or Tableau certification?
No certificate is required to get an analyst job, but a vendor certification can help your resume pass a first screen. Microsoft's Power BI Data Analyst Associate (exam PL-300) covers preparing, modelling, visualising and analysing data and managing Power BI, and expects proficiency in Power Query and DAX. Microsoft says the price depends on the country where the exam is proctored and that the certification is renewed every 12 months through a free online assessment. For Tableau, Salesforce offers the Tableau Data Analyst certification through Trailhead Academy; check its page for the current fee and format.
A strong project usually says more in an interview than a certificate alone. See our data analytics interview questions guide for how dashboards are discussed in interviews.
Frequently Asked Questions
Is Power BI better than Tableau?
Neither is better for everyone. Power BI is usually cheaper per user and fits Microsoft-based companies, while Tableau is often preferred for visual exploration and runs on both Windows and Mac. Choose based on the jobs you are targeting and the tools your employer uses.
Is Power BI free to learn?
Yes. Power BI Desktop is a free download for Windows, and a free account lets you create reports. Microsoft says you need Pro or Premium to share reports with others.
Is Tableau free?
Tableau Public and Tableau Desktop Public Edition are free. Anything you publish to Tableau Public can be seen by anyone, so use only public or anonymised data. Paid Tableau plans are priced per user.
Can I learn Power BI on a Mac?
Power BI Desktop is Windows-only, with Windows 10 or later as the stated minimum. Mac users often run Windows in a virtual machine, or start with Tableau, which runs natively on macOS.
How long does it take to switch from Tableau to Power BI or the other way?
As an estimate, a few weeks of focused practice. Charts, filters and dashboard design carry over directly. Most of the effort goes into the new calculation style: DAX in Power BI, or LOD expressions and table calculations in Tableau.
Should freshers in India learn both Power BI and Tableau?
Learn one well first and finish two or three projects with it. Once you are comfortable, a short project in the second tool lets you list both honestly on your resume.
Sources and methodology
Prices, plan names and platform requirements come from official vendor pages checked in September 2026. We did not use job-count figures because they change daily.
- Microsoft, Power BI pricing (India): Free account, Pro ₹1,165 and Premium Per User ₹1,995 per user per month paid yearly, GST extra, checked September 2026.
- Microsoft Learn, Download Power BI Desktop (free; minimum requirement Windows 10 or Windows Server 2016 or later), checked September 2026.
- Salesforce, Analytics pricing: Tableau Cloud starting at US$15 per user per month billed annually; Tableau Next listed separately, checked September 2026.
- Tableau Help, Tableau Public FAQ (free platform, public visibility, 15 million rows per workbook, extracts only, local save in Desktop Public Edition), checked September 2026.
- Tableau Help, Before you install (Tableau Desktop on Windows or Mac), checked September 2026.
- Microsoft Learn, Power BI Data Analyst Associate (exam PL-300, skills measured, price by country, 12-month renewal), checked September 2026.
- Salesforce Trailhead Academy, Tableau Data Analyst certification, checked September 2026. We could not load the fee from the official page, so we have not listed it.
The learning-curve comparison, employer patterns, decision table and 6-week plan are ISS editorial guidance, not measured data.
Next steps
Pick one tool using the job-post method above, then finish one complete project in the next month. Add the second tool once the first project is done.
If you want to build the SQL, Python and dashboard skills behind either tool in a live 16-week cohort, review the Data & Business Intelligence curriculum. Applying is free, and you pay only after accepting an offer: apply here. The free Data Analyst Starter Kit on this page is another place to start.