Salary context: Pay ranges in this article are retained estimates from its earlier edition, not a newly verified survey. Check dated sources for comparable roles, experience, location, and fixed versus total pay before relying on them.
Overview
Every digital action a customer takes generates data. When a user clicks an ad, adds an item to a cart, or abandons checkout, a record is created. However, raw data sitting in a database is useless on its own. Business Intelligence (BI) is the bridge between that raw data and strategic business decisions.
This guide breaks down what BI actually is, the core tools involved, and how you can start a career in data and BI by building the right skills.
Key Takeaways
The Data Pipeline
BI is not just making charts. It starts with ETL: Extracting data from sources, Transforming it into a clean format, and Loading it into a data warehouse.
Core BI Tools
SQL is the foundational language for data extraction. Power BI and Tableau are the industry standards for building interactive dashboards.
Focus on KPIs
BI transforms raw rows into Key Performance Indicators (KPIs) like Customer Acquisition Cost (CAC), Lifetime Value (LTV), and Churn Rate.
Decision Making
The ultimate goal of BI is to give executives and operators a clear, real-time view of the business so they can optimize operations.
How Does Business Intelligence Work?
The Business Intelligence process can be broken down into four main stages, often referred to as the Data-to-Decision Pipeline:
1. Data Collection (Extract)
Companies generate data across dozens of platforms: Salesforce (CRM), Shopify (E-commerce), Google Analytics (Web Traffic), and Stripe (Payments). BI starts by extracting this data via APIs and bringing it into a centralized staging area.
2. Data Cleaning & Modeling (Transform)
Raw data is messy. You might have "US", "USA", and "United States" in the same country column. Data transformation involves cleaning these inconsistencies and structuring the data into a Star Schema or Snowflake Schema. This is where data modeling happens, connecting fact tables (like Sales) to dimension tables (like Customers and Dates).
3. Data Storage (Load)
The cleaned data is loaded into a Data Warehouse (like Amazon Redshift, Google BigQuery, or Snowflake). A data warehouse is designed specifically for fast, complex analytical queries, unlike a standard transactional database.
4. Visualization & Reporting
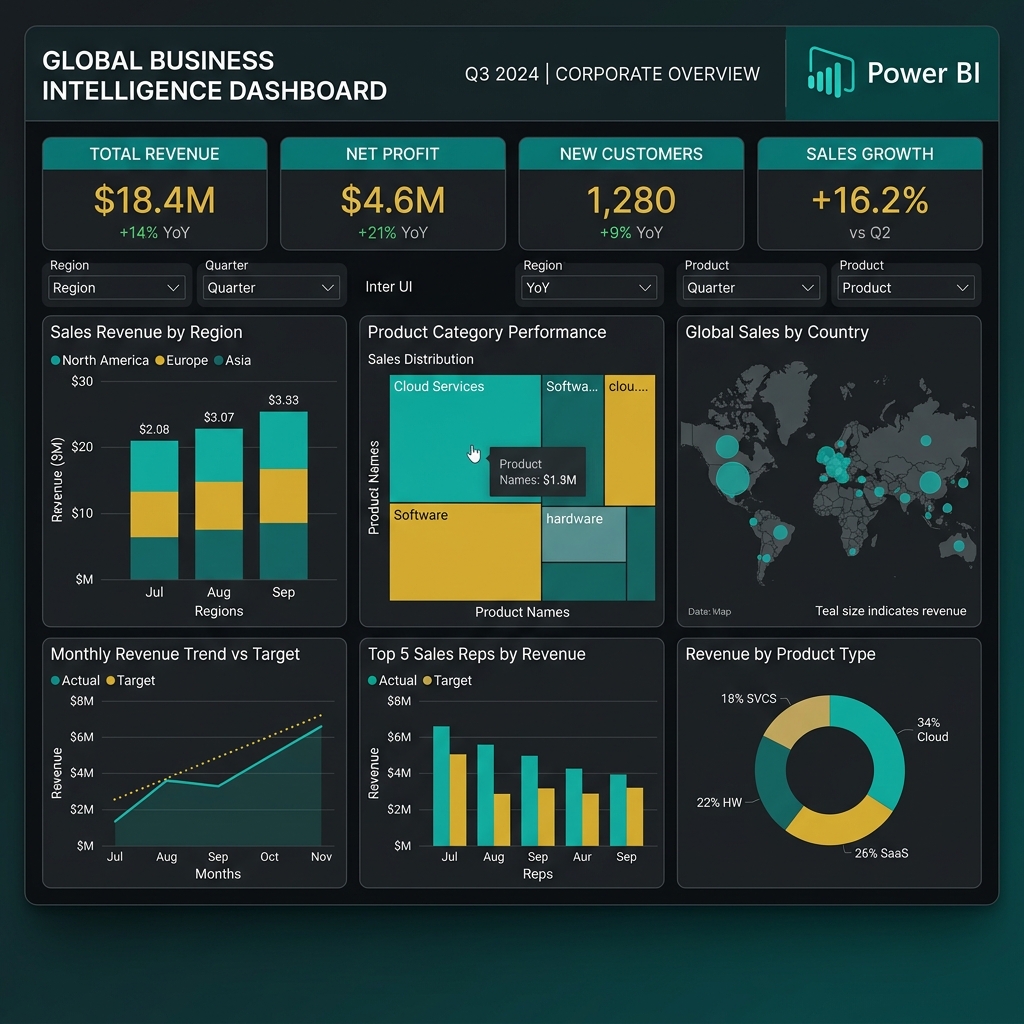
Finally, BI analysts connect tools like Power BI or Tableau to the data warehouse. They write SQL queries or use DAX formulas to calculate metrics, and present them in interactive dashboards. Instead of asking the data team for a report every week, business leaders can open a dashboard and filter the data themselves.
Business Intelligence vs. Data Analytics
These terms are often used interchangeably, but there is a distinct difference:
- Business Intelligence focuses on descriptive analytics. It answers "What happened?" and "What is happening right now?" (e.g., "Sales dropped by 10% last week in the Northern region"). For more on the specific roles, see our guide on Data Analyst vs Business Analyst.
- Data Analytics (and Data Science) focuses on predictive and prescriptive analytics. It answers "Why did it happen?" and "What will happen next?" (e.g., "Based on historical trends, sales will drop another 5% next week, so we should increase marketing spend").
Salary Expectations for BI Professionals in India
The demand for BI Analysts and Data Analysts in India is surging as more companies move to data-driven decision making. Here is a realistic look at the salary bands:
| Experience Level | Role | Average Salary Range (INR) |
|---|---|---|
| 0-1 year (Fresher) | Junior BI Analyst / Data Analyst | ₹4.5L – ₹7L |
| 2-4 years | BI Analyst / Dashboard Developer | ₹8L – ₹14L |
| 5+ years | Senior BI Engineer / Analytics Manager | ₹16L – ₹30L+ |
Salaries vary significantly based on location (Bengaluru and Gurugram pay a premium) and technical depth (advanced SQL and Python skills increase compensation).
Is the ISS Data & Business Intelligence programme right for you?
Review the curriculum for SQL, data analysis, and dashboard projects. Compare the learning format, weekly commitment, fees, and support with your goals before applying.
View Data & Business Intelligence curriculum →Real-World Examples of BI in Action
Example 1: E-commerce Inventory Management
An e-commerce company uses BI to connect its website sales data with its warehouse inventory data. The dashboard highlights products that are selling faster than expected and alerts the procurement team to reorder stock before a stockout occurs.
Example 2: SaaS Customer Success
A software startup uses BI to track user engagement. If a customer's usage drops below a certain threshold for two consecutive weeks, the dashboard flags the account as "At Risk of Churn." The Customer Success team uses this report to proactively reach out to the client.
Common Mistakes Beginners Make in BI
- Skipping SQL: Many beginners jump straight into Power BI because it's visual. But if you don't know SQL, you can't extract or structure the data you need to build the dashboard.
- Poor Data Modeling: Dumping all your data into one massive table instead of using a Star Schema makes your dashboards slow and your calculations inaccurate.
- Dashboard Clutter: A good dashboard answers specific business questions. Putting 15 different charts on one page confuses the user. Prioritize clarity over complexity. Check out our Data Analyst Projects for Resume guide for examples of clean dashboards.
Frequently Asked Questions
What is the difference between data analytics and business intelligence?
Business intelligence focuses on descriptive analytics (what happened and what is happening now) using dashboards, while data analytics often includes predictive analytics (what will happen) and deeper statistical modeling.
What are the most popular BI tools in 2026?
Power BI and Tableau remain the industry leaders. However, tools like Looker (for Google Cloud environments) and Metabase are also highly popular among startups.
Do I need to know coding to learn Business Intelligence?
You do not need to be a software engineer, but you absolutely must learn SQL to extract data, and DAX (for Power BI) to create calculated metrics. Python is a bonus but not strictly required for entry-level BI roles.
What does a Business Intelligence Analyst do daily?
A BI Analyst spends time writing SQL queries to pull data, cleaning the data, building relationships in a data model, and designing interactive dashboards for business stakeholders to review.
How long does it take to learn BI?
With structured learning, you can become job-ready in 4 to 6 months by mastering SQL, understanding relational data modeling, and building 2-3 comprehensive portfolio dashboards.
Editorial scope
This article provides an editorial learning guide, not a survey of hiring outcomes. Examples illustrate approaches to practice; they do not predict employment or pay.
Conclusion & Next Steps
Business Intelligence is the backbone of modern corporate strategy. Without it, companies are flying blind. By mastering SQL, data modeling, and visualization tools like Power BI, you position yourself as a critical asset who can turn confusing numbers into clear, actionable business strategies.
Ready to build a hirable data portfolio? Explore the ISS Data Analytics Program.
Start with a question and define the metric
For a sales report, specify whether “sales” means orders placed, revenue invoiced, or payments received. Check cancellations, missing dates, and duplicate records before building a chart. A report is useful only when its readers understand what its numbers represent.
Reference: Microsoft’s Power BI overview.